Corporate decision makers must have accurate, comprehensive, and current data to guide them. These decision makers will be spread both vertically and horizontally throughout the organization, and the decisions thus made are interlinked.
One wrong or conflicting decision can bring the whole thing down like a house of cards. For, example, should Sales and Procurement interpret a common data set differently, confusion and failure will soon follow.
Data Dashboards
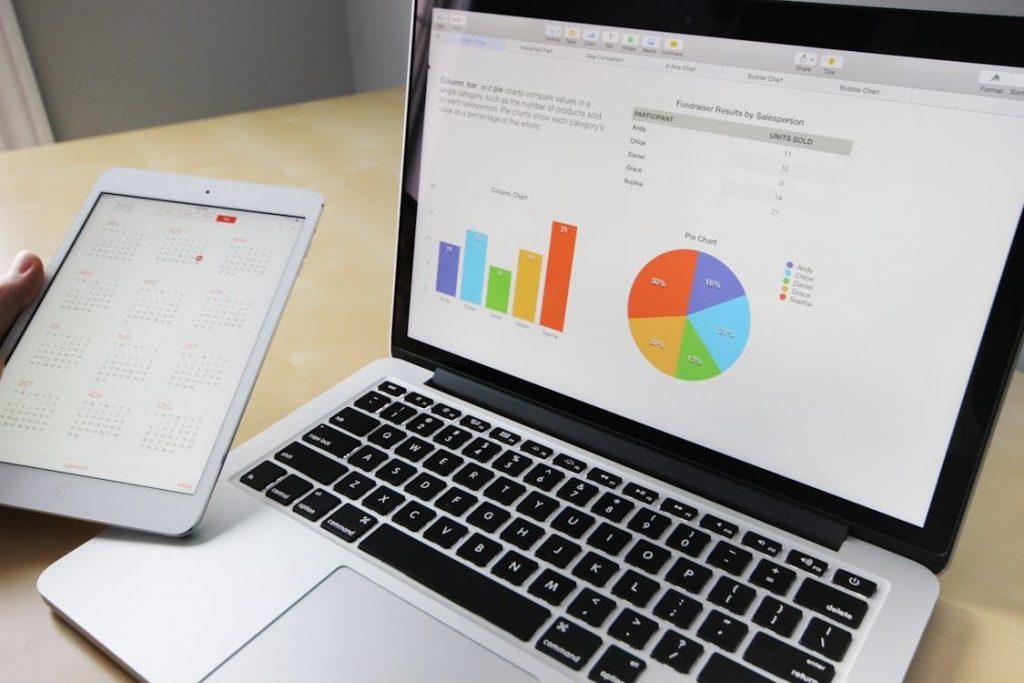
Data dashboards are visual representations of the key metrics that affect a business’s operations. These metrics are displayed visually as charts, graphs, and tables, and presented to key decision makers at various levels and across different areas of an organization. Regional logistics will use a different data dashboard than national marketing.
The more complex the organization and the dynamics of the field in which it exists, the more comprehensive the data dashboard must be.
But optimally comprehensive data can lead to information overload, especially when used across different fields of expertise.
The Evolution of the Data Dashboard
Thirty years ago, data dashboards were created manually and presented as a series of slides on an overhead projector. The problem with this was two-fold:
- These slides took a lot of time to create, and if any data element changed, all the dependent slides had to be recreated.
- Viewers quickly lost sight of the master slide as the presenter moved vertically or horizontally across the various fields.
While programs such as PowerPoint streamlined the dashboard creation process, the presentation was still linear, and the audience received it mainly passively.
Interactive Data Dashboard

In the early 2010s, several interactive data dashboards entered the market. These dashboards allowed users to interact with data. For example, the main board could simply have the organization’s geographic areas of operation, like USA, Canada, Mexico.
By clicking on a region, the board could display the main headers pertaining to that region, allowing users to dig down into specific operations, and filter it according to the needs of the user or division using it.
Users could go down as deep as needed to find and analyze the most granular data points, and even interlink horizontally with related divisions in the organization.
The Failure of Traditional Dashboards
While traditional dashboards worked well enough when they were launched, their shortcomings were soon exposed by the environment in which they operated.
The data for these boards had to be collected, analyzed, organized, and presented in graphic format by specialists before it could be included in a dashboard.
Slow and Clumsy
All this took time to do, and if any data point changed, all other data that depended on it had to be redone. This took more time, which became another problem.
In 2010, the speed of communication was measured Mbps, with 10 Mbps considered fast. Today, 5G averages 200 Mbps, with 20 Gbps possible. There simply is not enough time for human collection, analysis, and organization before the presentation was rendered stale by new data. Data dashboards were presenting the past and struggled to predict future trends and act upon these.
AI and the Future of Dashboards
We tend to view AI as irritating technology to dazzle the masses and help students gain more free time. But an AI-powered platform is a powerful tool when applied to business intelligence and the creation of quick, accurate, adaptable, and truly interactive and predictive dashboards.
Allowing Proactive Decision Making
The speed at which AI can gather, analyze, organize, and present data allows for quick decision making. The powerful analytical capacity of AI-driven business intelligence also allows predictive analysis, allowing a proactive decision making.
Flexible Presentation
The same data sets have to be accessed by different audiences, and the presentation has to be tailored accordingly. Different divisions will use different language; for example, engineering versus marketing, and also need unique combinations of data focus areas.
Doing this accurately and at speed, especially with the time constraints today, is only possible using AI driven dashboards.
AI for Better Decision Making
Speed and accuracy in decision making is key to success. AI has created a new divide which will affect the success or failure of organizations. On the one side will be those who embrace AI for all the benefits it will bring, while on the other side will be those left behind with old and stale technology.
AI is developing rapidly, which means there really is not much time to choose.


